Data Logger for Temperature and Humidity: Setup and Use
Set up a data logger for temperature and humidity in three steps: pick the placement, set the logging interval, and define your alarm limits before reading the history.
The Quindrel Team
October 24, 2026 · 6 min read
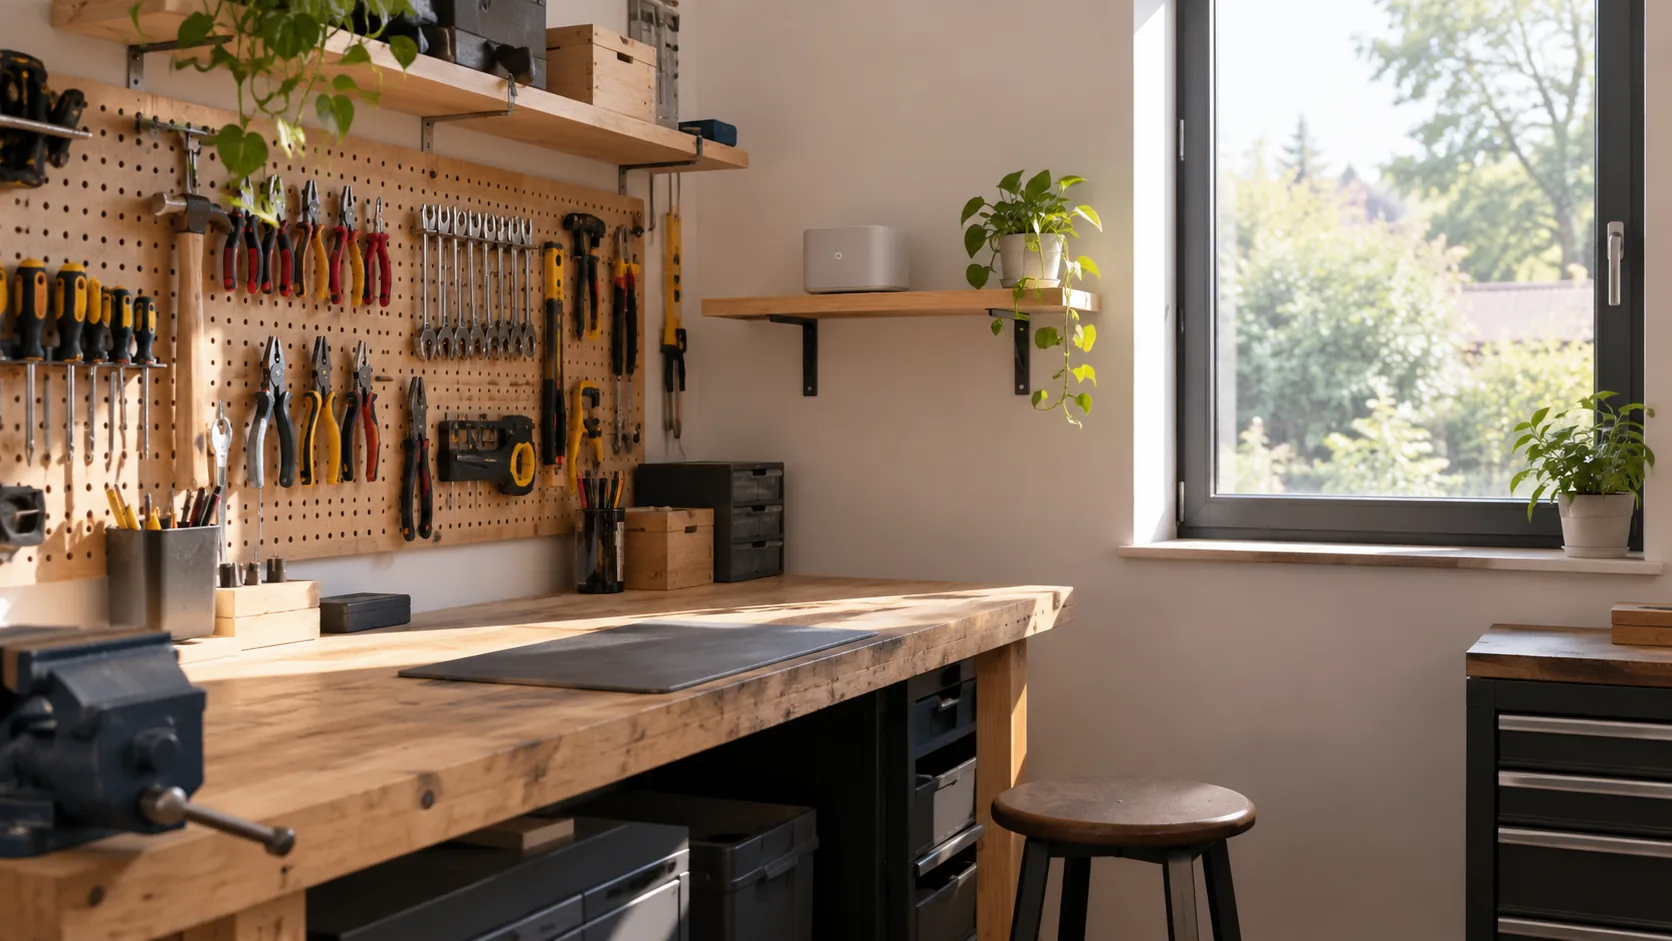
A data logger for temperature and humidity records both readings at a set interval, so you can look back through a history instead of checking one number at one moment. Set it up in three steps: place it away from heat sources and drafts, choose a logging interval that fits how fast the space changes, and decide your own alarm limits before you read the history. This guide covers garages, workshops and storage areas.
A logger answers questions a wall gauge cannot: when did the garage get damp, how far did the temperature swing overnight, and did the storage room stay in range while you were away.
Match a data logger for temperature and humidity to the space
Start with what you want to monitor and where the risk sits. Tool chests, stored leather, paper, wood stock and a fridge for supplies each have different trouble spots. A humidity and temperature data logger with a separate probe lets one unit cover two locations, which suits a workshop with a cold corner or a closed cabinet.
| Space | What to watch | Where the logger goes |
|---|---|---|
| Garage | Large temperature swings, damp air after rain | Interior wall at shelf height, away from the door |
| Workshop | Humidity near bare steel tools and wood stock | Near the tool storage, not over the heater |
| Basement storage | Steady high humidity, cold exterior walls | Mid-room, with the probe near the coldest wall |
| Fridge or cooler | Temperature of stored supplies | Probe inside, logger body outside |
| Closed cabinet | Trapped moisture | Probe inside the cabinet, logger on the outside |
A logger with two sensors for two locations
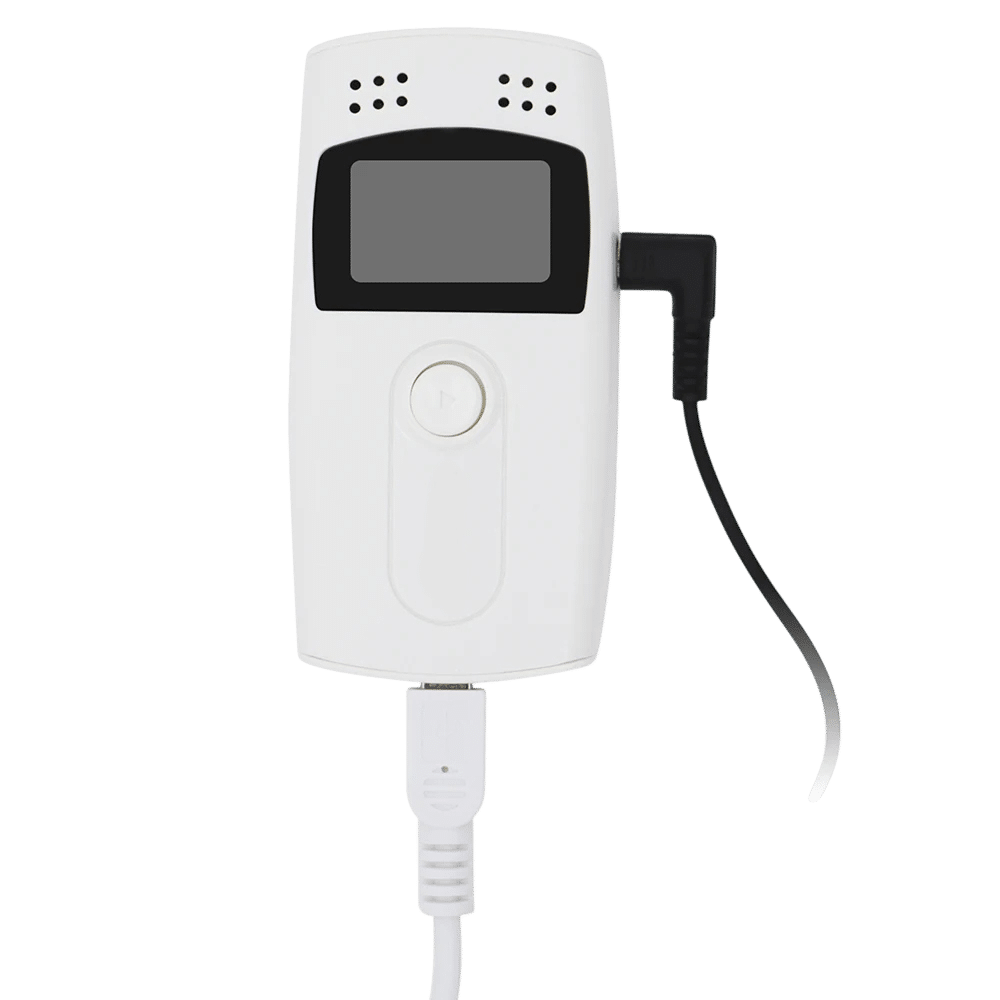
The ClimeTrace is a USB humidity and temperature logger. Its onboard sensor reads the air around the logger, and an external probe on a cable goes into a spot such as a fridge or wall cavity. It holds 16,000 readings, and you connect it to a computer with the USB cable to export the history as a PDF or Excel report.
 In this guideClimeTrace$89.99View
Where to place the logger
Placement decides whether the numbers describe the room or just the spot you chose. Use this checklist before you power the unit on.
- Keep it out of direct sunlight, which warms the sensor above the room air.
- Keep it away from heaters, compressors, water heaters and exhaust vents.
- Avoid the spot right beside an exterior door, where drafts distort the reading.
- Place it at the height where your items sit, not near the ceiling where warm air collects.
- Leave air space around it. Do not bury it in a drawer unless that drawer is what you want to measure.
- Put the probe where the risk is: inside the cabinet, against the cold wall or in the fridge.
If you want to compare two areas, such as the room and a closed cabinet, use the onboard sensor for the room and the probe for the cabinet. Route the probe cable so a door or lid does not pinch it.
Give it time to settle
When you move a logger from one room to another, the first readings reflect where it came from. Let it sit in its new spot before you judge the numbers.
Field note
Write the placement into the exported report's file name, such as "garage-north-wall". When you export several reports later, you will know which spot each history came from.
Set the logging interval
The logger records temperature and humidity at the interval you set. Each data logger temperature and humidity setup trades detail against duration. A short interval gives a detailed curve but fills the 16,000-reading memory sooner. A long interval stretches the memory across more days but can miss a brief spike. Check the manual for the interval options on your unit.
| Situation | Interval choice | Why |
|---|---|---|
| Finding the cause of a swing, such as a heater cycling | Short | You need to see the shape of each change |
| Fridge or cooler with frequent door opening | Short to medium | Door events show up as brief bumps |
| Garage or workshop over several weeks | Medium | Daily cycles stay visible without filling memory |
| Seasonal storage you rarely visit | Long | Slow drift matters more than short spikes |
To estimate how long a recording lasts, multiply the number of readings the memory holds by your interval. Check the manual for how temperature and humidity readings count toward the 16,000, so the estimate does not mislead you. Then download the history before the memory fills, and put a download date on your calendar.
Set alarm thresholds that match your goal
Decide your limits before you read any data. An alarm threshold is simply the high and low value at which you would act, such as moving tools into a cabinet or running a dehumidifier. Write them down for each space.
- List what is stored and what harms it: bare steel, wood stock, paper, adhesives, supplies in a fridge.
- Check the storage instructions on those items and the manual for your equipment.
- Write a low and a high value for temperature and for relative humidity.
- After each download, scan the history for any reading outside those limits.
The ClimeTrace stores a history for you to look through after export; check its manual for any on-device alert features before you rely on one. If you need a live warning, pair the logger with a routine of regular downloads or add a separate alerting device.
Read the history: what the numbers mean
Connect the logger by USB, pull the stored readings, and export the PDF or Excel file. Each reading carries its time, so you can line up changes with events in your day. A data logger for temperature and humidity is most useful when you read the humidity readings next to the ambient temperature at the same moment.
Look at four things
- Min max values for each day show how far the space swings.
- The daily cycle: ambient temperature tends to climb in the afternoon and fall overnight, while relative humidity can move the opposite way.
- Sudden spikes: a short jump points to a door, a wet vehicle, a washing machine or a heater switching on.
- Slow drift: a steady rise across days points to a seasonal change or a damp source.
Relative humidity depends on temperature. Warm air holds more moisture, so the same amount of water in the air reads as a higher percentage when the room cools. A cold night can push humidity up even though nothing wet entered the space. Read the two lines together, not one at a time.
For more on why sensor position changes what a reading tells you, see why sensor placement matters in a kitchen setting; the same idea applies to a probe in a cabinet.
Common mistakes to avoid
- Placing the logger on a tool chest lid that sits in sun for part of the day.
- Leaving the probe coiled on a shelf instead of in the area you meant to measure.
- Choosing a short interval, then letting the memory fill before downloading.
- Judging a space on one afternoon of data. Log across a full cycle of weather and use.
- Comparing a reading from the logger with a gauge placed somewhere else.
- Changing the position mid-recording without noting the date.
Routine checklist
| When | Task |
|---|---|
| At setup | Choose spot, set the interval, note the start date |
| Each download | Export the PDF or Excel file, scan for out-of-range readings |
| After a change | Note new heater, dehumidifier or layout and compare before and after |
| Each season | Look through the history, adjust your limits and placement |
If you also want a simple live readout in another room, browse the Weather, Air & Moisture Meters collection. Keep the logger for the history and a basic meter for a glance.